NOAA Teacher at Sea Caroline Singler getting ready to board the U.S. Coast Guard Cutter Healy in Dutch Harbor AK

Saturday, August 14, 2010

Maneuvering in Ice – 7-10 August 2010

NOAA Teacher at Sea: Caroline Singler
Ship: USCGC Healy
Mission: Extended Continental Shelf Survey
Geographical area of cruise: Beaufort Sea in the Arctic Ocean
Date of Post: 13 August 2010

Location and Weather Data from Bridge
Date: 11 August 2010 Time of Day: 1015 (10:15 local time); 17:15 UTC
Latitude: 71º 23.2’ N Longitude: 144º 43.2’ W
Ship Speed: 9.7 knots Heading: 106.6º (ESE)
Air Temperature: 5.1ºC /41.2ºF
Barometric Pressure: 1010.6 millibars Humidity: 100%
Winds: 30.6 knots ENE Wind Chill: -2.2ºC /28.14ºF
Sea Temperature: 4.8ºC Salinity: 23.70 PSU
Water Depth: 2952.9 m

Date: 12 August 2010 Time of Day: 1900 (7:00 local time); 02:00 UTC
Latitude: 71º 10.94’ N Longitude: 144º 40.28’ W
Ship Speed: 11.9 knots Heading: 265.3º (WSW)
Air Temperature: 6.73ºC /44.12ºF
Barometric Pressure: 1016.7 millibars Humidity: 97.9%
Winds: 18.8 knots ESE Wind Chill: 3.96ºC /39.12ºF
Sea Temperature: 6.0ºC Salinity: 24.32 PSU
Water Depth: 2496.0 m

Science and Technology Log
I want to give you a sense of how ice can affect the progress of the ship. It was not something that I could imagine before coming on the Healy. When we first encountered ice, I was captivated by its beauty – it is a wilderness of an entirely different sort than I have ever experienced. I knew the ice would slow our progress, and I knew from talking to the scientists that it could complicate the mapping with the multibeam system. I did not realize all the ways in which it would challenge everyone involved in the mission, for example:

  • the chief scientist and the rest of the science team have to decide how to alter the ship’s track without sacrificing the mission objectives;
  • the ice analysts use satellite imagery and ice buoy data and try to predict where the ice may be and advise the Chief Scientist and the ship’s crew regarding possible changes in course;
  • the Coast Guard officers and crew who try to keep us as close to our planned course as possible, keeping in constant communication with the Chief Scientist and with the watch standers in the geophysics lab to be sure that we are able to collect good data;
  • the computer specialists have to figure out how to get the best ultibeam data, even when ice clogs the seawater intake that provides data for the sound speed profile and when sound beams transmitted from the surface bounce in all directions and cannot find bottom;
  • geophysics watch standers like me have to watch for tiny clues from the instruments that the ice might be interfering with the transmission of the sound signals and the acquisition of reliable data.

Everything about working in the Arctic is a lesson in patience and flexibility; one must learn to “go with the floe”.

Since our primary objective is to collect bathymetric data, the locations of transect lines were determined before the mission to best meet the objective. Some lines provide data about previously unmapped areas; others fill in gaps between existing data tracks. We are able to follow the plan when we are in open water, but once we are in the ice, sometimes plans change. This became immediately apparent when I went on watch on the night of 7 August. We were heading north in the Beaufort Sea into thicker ice. There was a flurry of activity in the geophysics computer lab. The scientists were studying the ship’s track and the latest satellite images of the ice. We were on course to encounter some very large floes. I was about to get my first real taste of what an ice breaker does.

An ice breaker is designed differently from other ships. It is double-hulled with extra thick steel at the bow, stern and water line. It has a flat hull with a rounded bow that slopes gradually upward to allow it to ride up over the ice. (I am told that same feature makes it roll considerably in rough seas, though thankfully the Healy’s design is somewhat modified from the earlier Coast Guard ice breakers, so it does not roll as much as it could!) There are numerous mechanical modifications that allow ice breakers to work in an environment that would crush other ships. (See Cool Antarctica for a good summary of the characteristics of ice breakers.) The ship weighs over 11 tons, and the basic principle of ice breaking is to ride up over the ice and allow gravity to do the work, using the ship’s weight to fracture the ice. Healy’s typical cruising speed is 12 knots, with a maximum of 17 knots; depending on ice conditions, Healy's speed typically decreases to 7 knots, and it is often necessary to go even slower through large floes, particularly if the multibeam is not recording good data. In the thickest ice, the ship uses a technique called “backing and ramming” which is pretty much exactly as it sounds – the ship is driven on the ice, then backed up and driven back onto the ice again. But while Healy is a powerful ship, a large tabular floe of multiyear ice has a lot of inertia, and it takes an incredible force to move it. More often than not, it is a better idea to try to find a way around the large floes instead of breaking through them.

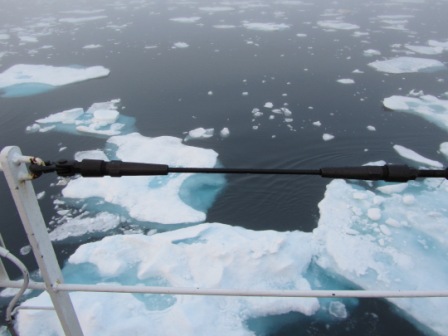
The next few photos show what happens when Healy breaks through ice. Cracks radiate out in all directions as the weight of the ship is forced into the floe. The deep blue color indicates that much of the ice is “multiyear ice” – ice that has lasted through at least one summer melting season.


The following maps show how one large floe affected our progress in the early morning hours of 8 August 2010. I came on watch at 8:00 p.m. local time (04:00 UTC) on 7 August. We were at the point labeled “0” on the first map, travelling through open water and light ice at a speed of approximately 11.7 knots. We reached point “1” at 11:30 p.m. (07:30 UTC) and were beginning to slow down in the ice. In 3.5 hours, we covered a distance of 38.88 nautical miles (nm), at an average speed of 11.1 knots. At 12:57 a.m. (08:57 UTC), we reached point “2”, 7.89 nm from point 1 – that’s an average speed of about 5.3 knots.

Things got tricky after that. Notice the change in scale on the second map, which shows the ship’s progress over the next 3 hours until point “11” at 4:00 a.m. (12:00 UTC) on the 8th. In that time, we covered 15.48 nm and had to deviate off a straight line course and change direction several times to maneuver around ice. Our average speed continued to be about 5 knots, but there were times during that stretch when the speed was a low as 1 or 2 knots. Relative to the original planned straight line course, the distance covered in that period was 6.7 nm.
Map 3 shows the remaining course we followed for that transect (the right hand track line) – note again the different map scale. We covered the remaining distance along the line between points 11 and 12, about 91 nm, over the next 3 hours. The trackline on the left shows our subsequent course, about a day later.
It takes a special ship to do what Healy does, and it takes a crew and science team who are capable, flexible, and cooperative to get the job done.

Personal Log

A lot happened in the last few days. If you pay attention to the location information at the beginning of some posts, you will notice that we have traveled north and south, east and west through the Beaufort Sea between the Mackenzie Delta region on the Canadian coast and the Prudhoe Bay area of the Alaska coast. We had the long-awaited rendezvous with Canadian Coast Guard Cutter Louis S. St. Laurent on Tuesday 10 August. Three members of our science team (two marine mammal observers and one ice analyst) went to the Louis and three members of their team joined us on the Healy. It was exciting to watch the helicopter exchange of personnel. I was not prepared for how fast the helicopter moved, and I was not quick enough to capture any close-ups. Here’s a look at the helicopter approaching the helo pad aft on Healy
and flying back to the Louis.

We took some cores of the seafloor on Wednesday and Thursday – more on that exciting change in routine in another post. We were out of the ice for several days, and I missed it, but we are moving north again now, farther north than we have been so far and we have started the cooperative part of the mission, in which Healy will lead and break ice for Louis.

Tomorrow, it seems, is Saturday. It is extremely hard to keep track of the days at sea, especially when there is not much darkness at night. Saturday is cleaning day, so we have to make sure everything is “ship-shape” in our staterooms and the science work areas. Stay tuned for some photos of my room after it’s neat and tidy!

Did you know?

Distance at sea is typically measured in nautical miles. One nautical mile is equal to approximately 1.15 statute miles or 1.85 kilometers. Speeds are measured in knots. One knot is equal to 1 nautical mile per hour or 1.15 miles per hour.

Caroline

Tuesday, August 10, 2010

Polar Bear, Polar Bear! – 9 August 2010


Yes, folks, they are out here. There were a couple of sightings on Sunday 8 August, but I missed them both. However, Monday 9 August 2010 was the day that I saw my first polar bear in the Arctic. The last time I saw a polar bear was in the St. Louis Zoo, and it looked about as unhappy to be in the heat and humidity as I was. This time was a lot different.


I received a page while working in a lab on one of the lower decks. Before I turned off my pager, Bill came running down to get his camera and told me there was a polar bear off the port side of the ship. We could just barely see a spot on the distant horizon, slightly less white than the surrounding ice. I went up to the Bridge to get a better view, and most of the science team was there. I didn’t have to ask where it was; I just followed the line of everyone’s binoculars and cameras. Once I had a sense of what to look for and where to look, it became easier to spot, and it obliged us by moving closer to the ship. We were holding position at the time for a water sampling event, so we got a good long view as the bear ambled along. It was like watching a nature movie. It stopped every once in a while to sniff the air, and it walked along, stepping or jumping across melt ponds on the ice. We watched for at least a half hour before it moved out of site.

Here are some of my best shots.


I hope those images help cool you off for a minute or two!
Caroline

Saturday, August 7, 2010

Seeing the Bottom -- 7 August 2010

NOAA Teacher at Sea: Caroline Singler
Ship: USCGC Healy
Mission: Extended Continental Shelf Survey
Geographical area of cruise: Arctic Ocean 41 miles north of Alaska
Date: 9 August 2010

It’s taken me several days to write and post this entry. I wanted to learn more about the sonar technology that we are using for the bathymetric mapping, then we lost internet early on the morning of 8 August 2010 while heading north in the Beaufort Sea. This happened at about the same time as we started encountering heavy ice, but I do not believe that the two events were related. I am including location and weather data for several days to give you a sense of where we were and where we are heading as well as the physical changes in our environment.

Thankfully, email works even when internet does not – it took my non-IT oriented mind a while to wrap itself around that concept. While I am out of range, my dear sister Rosemary has agreed to post for me as long as I can get emails to her. (Thanks, Ro!) You already have her to thank for the polar bear post. Please keep emailing and/or posting comments. I look forward to reading comments when I come home.

Location and Weather Data from the Bridge

Date: 7 August 2010 Time of Day: 1400 (2:00 p.m.) local time; 22:00 UTC
Latitude: 70º47.6’N Longitude: 142º42.3’W
Ship Speed: 15.1 knots Heading: 111º (southeast)
Air Temperature: 5.1ºC /41.6ºF
Barometric Pressure: 1005.3 millibars Humidity: 87 .9%
Winds: 27.7 Knots NE
Sea Temperature: 2.3ºC Salinity: 20.22 PSU (practical salinity units)
Water Depth: 1270 .8 m

Date: 8 August 2010 Time of Day: 1245 (12:45 local time); 20:45 UTC
Latitude: 72º12.72’N Longitude: 138º28.7’W
Ship Speed: 7.7 knots Heading: 36.2º (NE)
Air Temperature: 0.5ºC /32.9ºF
Barometric Pressure: 1012.7 millibars Humidity: 86.3%
Winds: 19.3 Knots NE Wind Chill: -7.48ºC/18.53ºF
Sea Temperature: -1.2ºC Salinity: 25.5 PSU
Water Depth: 2547.8 m

Date: 9 August 2010 Time of Day: 1530 (3:30 local time); 22:30 UTC
Latitude: 72º 29.8’N Longitude: 139º 40.9’W
Ship Speed: 6.3 knots Heading: 183.5º (SSW)
Air Temperature: -0.03ºC /31.94ºF
Barometric Pressure: 1009.7 millibars Humidity: 92.2%
Winds: 17.7 Knots NE Wind Chill: -6.02ºC /21.17ºF
Sea Temperature: -1.2ºC Salinity: 25.08 PSU
Water Depth: 2969.0 m

Science and Technology Log
The primary objectives of the science mission are to map the seafloor and image the underlying sediments. Bathymetry is the measurement of depth of water bodies, derived from the Greek bathos meaning deep and metria meaning measure. Early bathymetric surveys used the "lead-lining" method, in which depths are manually recorded using a weighted line. This method is slow and labor intensive, and it is not practical for depths greater than about 100 feet. (Ironically, I spent the summer of 2009 doing just such a survey of a small lake on Long Island, NY working with two other teachers as DOE-ACTS interns at Brookhaven National Laboratory.) Modern bathymetric surveys use echo sounding, or SONAR (Sound Navigation and Ranging) to determine depth and shape of the seafloor. These systems make it possible to map large areas in extreme detail, leading NOAA to name the 20th Century advancements in hydrographic surveying techniques to its list of Top Ten Breakthroughs during the agency's first 200 years.

SONAR uses sound signals to locate objects beneath the sea surface. Passive systems use receivers such as hydrophones to detect signals transmitted by other sources, such as animals or submarines. Active systems transmit and receive signals. A transmitter mounted on the ship’s hull emits a signal. The signal travels through the water column and bounces off an object in its path. It returns as an echo to a transmitter on the ship that measures the strength of the return signal. The time between transmission and reception is used to determine range, where range equals (speed of sound in seawater) times (travel time divided by 2). When the object that reflects the signal is the seafloor, the range is the water depth.

There are single beam and multibeam sonar systems. Single beam systems measure along a single line beneath the ship and produce a line of depths. Multibeam systems send signals out along a line perpendicular to the ship and generate a “swath” of data for the area beneath the ship. The advantage of this system is that it creates a map that shows depth and shape of the seafloor. The diagram below shows a schematic comparison of three bottom survey methods.

Healy is equipped with a hull-mounted multibeam sonar system. It runs continuously whenever Healy is at sea, collecting bathymetric data to add to our knowledge of the seafloor at high latitudes. I serve as one of the watch standers in the geophysics lab each night from 8 p.m. to 12 a.m. We keep an eye on several computer monitors that display the data from the different geophysics tools and others that display water quality and geographic position data. The photo on the right shows me with my watch partner, USGS scientist Peter Triezenberg sitting at the watch station.

There are many variables that can influence the quality of the multibeam data. The speed of sound in water is influenced by many different variables, including temperature and salinity. Therefore, seawater samples are collected from the ship’s seawater intake system to generate a thermosalinograph (TSG) profile to keep the speed of sound accurately calibrated. Additionally, expendable probes (XBTs) are launched twice a day to update the sound speed profiles. Other instruments monitor the attitude (pitch, roll and heave) of the ship and feed that data to the multibeam system. Finally, the ship keeps extremely precise track of time of day and geographical position so that the data can be used for accurate bathymetric mapping of the seafloor. My job as a watch stander is basically to be sure that everything is running properly, and to notify one of the specialists if something is not right.

Multibeam monitors:


TSG display:


The end result is a detailed map of the seafloor in which different colors represent different depths. The picture below shows an image of the raw multibeam data superimposed on a seafloor map which we can see on the ship’s Map Server display. The red line shows the ship’s track, and the new multibeam data extends perpendicular to that line. Other data on the map are from transects mapped on earlier Healy cruises and other sources.

Sources:
NOAA Ocean Explorer http://oceanexplorer.noaa.gov/technology/technology.html
NOAA 200th Top Tens - The Breakthroughs
http://celebrating200years.noaa.gov/breakthroughs/welcome.html

Personal Log

We experienced a range of sea and ice conditions over the last several days as we traveled east of Barrow Alaska and headed north into the Beaufort Sea. Our earliest ice encounters were a gentle preview of what was to come - mostly bumps and scrapes with small pieces as we headed eastward parallel to the Alaska coastline. By midday on Saturday, we began to cross larger floes, and at times the ship was really rocking. One science team member said it feels like riding the subway, that’s a pretty good analogy. Sitting in the Mess on the main deck of the ship – which is about one floor above water line – I hear the grinding of ice on steel and it feels like I’m sitting in a big tin can that’s being crushed in a trash compactor. Fortunately, the ship is tougher than the ice. At times we move so much that everything in the room shakes. Because we are on a ship, everything is bolted down, but I still look up to be sure there is no danger of anything falling on my head. Some team members from California say the sensation reminds them of an earthquake.

Late Saturday morning, we crossed out of ice and back into open water. As we approached the last pieces of ice before open water, I saw waves hitting the distant edges of the ice; it looked like waves breaking on the shore. At first, I did not grasp the significance of this observation – I thought it was pretty and snapped some pictures and marveled at how we could be in thick ice and then suddenly in open water.


In the next hour, I realized that these were the largest waves we had encountered so far on the trip, and while they looked pretty, they also made the ship roll considerably more than it had before. Over the next few hours, I began to sense the movement more than I had in a few days. By dinner time, I had difficulty walking straight across the mess deck, and I was becoming a little apprehensive. I took a motion sickness pill as a preventative measure, and I took a nap because it was far more pleasant to lie in my rack and be rocked by the ship’s motion than to try to remain vertical. We eventually moved into calmer waters, and soon after that, we were back in heavy ice, which I somehow do not find as unpleasant as the waves. Since then, our movement has been slow and steady along our transects through the ice, with an emphasis on slow.

We don’t get much darkness up here in the Arctic, but we do occasionally get treated to some great sunrises and sunsets, if one is awake to catch them. Here are some photos of the sunset on Saturday 7 August 2010. The first was taken about an hour before sunset from the port side of the ship. I was as captivated by the horsetail clouds as I was by the color of the sky. The second was taken just at sunset, right before my camera battery died!

Caroline


Friday, August 6, 2010

Ice, Ice, Baby!


I've had that song in my head since we left Dutch Harbor - well actually that's the only line I know, and we encountered our first sea ice early this morning, Friday 6 August 2010.

We knew it was coming eventually, and a look at a satellite overlay on the ship tracker during last night's watch revealed that we were getting close to the ice. The white areas to the south of the ship are clouds, but you can see broken white patches north of the ship's track that are sea ice.

My watch ended at midnight, and we estimated that we'd be in the ice around 4:00 a.m., so I set my alarm for that time. At first I forgot why my alarm was going off, but then I heard a new sound, something I had been told to expect, and I realized it must be the sound of the ship's hull scraping against the ice. I looked out the porthole to see patches of ice passing by, so I put on some warmer clothes and headed out on deck and then up to the bridge for my first look at sea ice. I'll have plenty of opportunities to talk more about ice and the work of an ice breaker over the next couple of weeks, but for now, I want to share with you what I saw. I think you'll understand why I feel so blessed to have the opportunity to be here.
Enjoy!
Caroline

These were my first views from the fore deck. Notice the sky:


The bridge provides some of the best views in the house. The fact that the sun chose to make an appearance through the clouds and early morning mist only added to the beauty.


Throughout the day, the ice came and went. At times, we rammed into large floes with such force that the entire ship rocked and groaned. Other times, the water was almost ice free.


Here I am in the Arctic Ocean, and I cannot imagine a better way to spend the summer!


Thursday, August 5, 2010

Crossing the Arctic Circle


On 4 August 2010 at 2017 local time (5 August 2010 04:17 UTC), I crossed the Arctic Circle as a passenger on the USCGC Healy. One of the advantages of being on watch was that I was staring at a computer screen and could photodocument the moment – well, I missed it slightly as I adjusted the camera, but I came close!The map below shows the ship’s position at the time of our crossing. (I can't figure out how to make it larger, so look for the little red dot!)
The skies have cleared considerably over the last couple of hours. Here are a couple of photos taken from outside the lab, which is located near the stern of the ship.
Looking fore and to port:Looking aft:

Several people have told me about the recent aurora activity. Unfortunately, between fog and increasing number of daylight hours, we cannot see the displays.

From NORTH of the Arctic Circle,
Caroline

New terms
Polar Bear – one who has previously crossed the Arctic Circle at sea and has been initiated.
Blue Nose –one who is making his/her first crossing of the Arctic Circle or has previously crossed and has not been initiated.

Wednesday, August 4, 2010

In the Bering Sea – 3 & 4 August 2010

NOAA Teacher at Sea: Caroline Singler
Ship: U.S. Coast Guard Cutter (USCGC) Healy
Mission: International Continental Shelf Survey
Geographical area of cruise: Bering Sea en route to Arctic Ocean
Date: 4 August 2010

Location and Weather Data from the Bridge
Time of Day: 1600 (4:00 p.m.) local time; 00:00 UTC (Coordinated Universal Time)
Latitude: 65º19’N Longitude: 168º16’W
Ship Speed: 16.9 knots Heading: 358.1º
Air Temperature: 11.33ºC /52.38ºF
Barometric Pressure: 1009.3 millibars Humidity: 94.9%
Winds: 9.6 Knots SSE
Sea Temperature: 9.9 ºC
Water Depth: 53.6 m

Science and Technology Log
Since leaving Dutch Harbor on 2 August 2010, the USCGC Healy has traveled north through the Bering Sea en route to the Arctic Ocean, where we will embark on the third year of an international effort called the Extended Continental Shelf Project. In a few days, we will rendezvous with the Canadian Coast Guard Ship (CCGS) Louis S. St. Laurent in the Arctic Ocean. The objectives of this mission are to perform detailed bathymetric mapping of the seafloor and imaging of the subsurface and to collect physical seafloor samples in the part of the Arctic known as the Beaufort Sea and Canada Basin. I will write more about this over the next few days; in a nutshell, we want to determine the limits of the extended continental shelf in that region. Our primary role on the Healy is to serve as the lead ice breaker for the Louis so that she can collect multichannel seismic reflection data of the subsurface. At the same time, Healy will collect multibeam bathymetric data and high resolution seismic reflection data and obtain seafloor samples using a variety of dredging and coring methods. The extent of our work may be influence by sea ice conditions which can be unpredictable.

One of my responsibilities on the cruise is to serve as a "Watchstander" for the geophysical data collection. Watchstanders work in pairs and are responsible for keeping an eye on the computer monitor displays of the data that is continuously collected by the multibeam sonar and “chirp” (seismic reflection) data and to call in the experts if something goes wrong. Water depths are shallow and the seafloor relatively featureless on our traverse through the Bering Sea, but the data will likely become more interesting when we reach out destination. This is the time to learn about the equipment and understand our responsibilities so that we’ll be sharp when our data collection efforts become more critical. Last year’s mission mapped a previously undiscovered seamount! My watch is from 2000 to 0000 (8 p.m. to midnight), which leaves me lots of time during the day to write, research, and wander around learning about the ship. Later in the mission I will be involved in the sampling efforts when I am not on geophysical watch.


Personal Log
It has been smooth sailing since leaving Dutch Harbor, and we have moved relatively quickly, slowing occasionally when the fog thickens. Foggy conditions are common in the Bering Sea and Arctic Ocean. I went out on deck early yesterday evening to enjoy a brief period when the sun was visible above the fog, and was treated to the sight of a “fog bow”.

NOSB folks will be happy to know that my puffin is accompanying me on my journey, even when I'm on watch.

I’ve seen both horned puffins and tufted puffins from the ship, and I'm beginning to be able to tell the difference, but nothing beats the show the horned puffins put on for us in Dutch Harbor. If you want to see awesome bird shots, take a look at Bill Schmoker’s journals, which you’ll find linked on the upper right side of my blog page.

Earlier this afternoon, we passed near a small island called King Island in the northern Bering Sea. There was a lot of seabird activity closer to shore, and I was fortunate to be on the Bridge watching when the marine mammal observer saw a gray whale. I got to see it surface and dive once; no time for a photo, just firsthand enjoyment of the experience.


I took a break while writing this log to go back to the Bridge as we passed through the Bering Straits. The view was the same as it was for the rest of the day, but I wanted to have the best view in the house for the experience.

Today is Coast Guard Day which commemorates the formation of the Revenue Cutter Service in 1790. In honor of the occasion, the Coasties roasted a pig out on the helo (helicopter) deck and served a picnic style dinner in the Mess tonight.

Did You Know?
I did a search to learn more about Coast Guard Day. According to the U.S. Department of Defense, the Treasury Department established the Revenue Cutter Service in 1790 and “authorized the building of a fleet of ten cutters, whose responsibility would be the enforcement of the first tariff laws enacted by Congress under the Constitution.” The name “Coast Guard” was adopted in 1915.
Source: U.S. Department of Defense

Tuesday, August 3, 2010

We’re Off! – A look back at Monday 2 August 2010


We left the port of Dutch Harbor on the U.S. Coast Guard Cutter Healy at 1500 on Monday, 2 August 2010. I first saw the Healy from a distance. While walking through Unalaska on Friday morning, I stopped to take some photos looking back towards Dutch Harbor across Iliuliuk Bay and I saw a red and white ship at a distant dock. I couldn’t read the writing on the side, but a local fisherman stopped to talk to me and told me that I was looking at an ice breaker, so I knew it must be Healy. We boarded the ship on Sunday afternoon, and it is much more impressive up close.

It’s such a huge ship that I hardly noticed a change in sound or movement when they fired up the engines. Standing on one of the weatherdecks looking over the bow of the ship, I was unaware that we were moving until I walked around to the starboard side and realized that the space between us and the dock was increasing. I wandered around taking photos as we made our way towards open water. Dutch Harbor is located on a small island called Amaknak Island – the peak on the right is Mt. Ballyhoo.


As we made our way into more open water, I took a photo of a prominent sea stack which someone told me is Priest Rock, a landmark often referred to on “Deadliest Catch”.

I spent the first day learning my way around the ship and attending various briefings. I quickly realized that when I’m inside, I have no sense of direction. My stateroom is on the port side of the 02 deck, right across from Sick Bay (which I hope I will not need) and not far from the Science Conference Room, so I can orient myself if I can find my room. So far, the only sign that we are at sea is a gentle rocking motion and the occasional sound of the fog horn. Here’s the view from my stateroom, taken a few hours after we left port.

An important part of the first briefing was learning about what to do during a ship emergency. If we were to ever have to abandon ship, each person on the boat must don a survival suit, affectionately referred to as the Gumby suit. It looked pretty easy when demonstrated by one of the “Coasties”. However, watching and doing are certainly two different things, so anyone who had never tried one on before was required to do so. I cannot explain the eerie feeling of getting into one and zipping it up and realizing that in an emergency, my ability to do that again might mean my survival. It was much more difficult than it looked, and I definitely needed help finding all the straps and attachments. I hope it is the last time I’ll ever have to do that. Here I am in my suit together with Jerry, another member of the team. It’s a stylish look, don’t you think?

Now that we are underway, I will begin to learn about the science on our mission and will write about it in my logs. I’m going to switch to the more formal log format recommended by the NOAA Teacher at Sea program. Feel free to comment or email if you have any questions about my log, if you are curious about life at sea, or if you just want to say hello.

Caroline